I’m currently learning TikZ, a \(\LaTeX\) package that aids in creating graphical elements. This cheat sheet serves as a handy reference to help me remember my TikZ code.
TikZ Online Manual
Picture
Environment Notes
TikZ Package
Notes
Tikz
Examples
Lines
\documentclass{standalone}
\standaloneconfig{border=2mm 2mm 2mm 2mm}

%tikzpicture
\usepackage{tikz}
\usepackage{amsmath}
\usepackage{physics}
\usetikzlibrary {calc} %Required for Tangent Coordinate Systems
\usetikzlibrary {patterns} %Required for Graphic Parameters: Fill Pattern
% For vector sum
\tikzset{>=latex} % for LaTeX arrow head
\usepackage{xcolor}
\colorlet{veccol}{green!45!black}
\colorlet{myred}{red!90!black}
\colorlet{myblue}{blue!90!black}
\colorlet{mypurple}{blue!50!red!80!black!80}
\tikzstyle{vector}=[->,very thick,veccol]
\usetikzlibrary{arrows.meta}
\tikzstyle{thin arrow}=[dashed,thin,-{Latex[length=4,width=3]}]

\begin{document}
\begin{tikzpicture}%[scale=3]

% Grid
%\draw [step=1,lightgray] (0,0) grid (10,10);

% Help lines
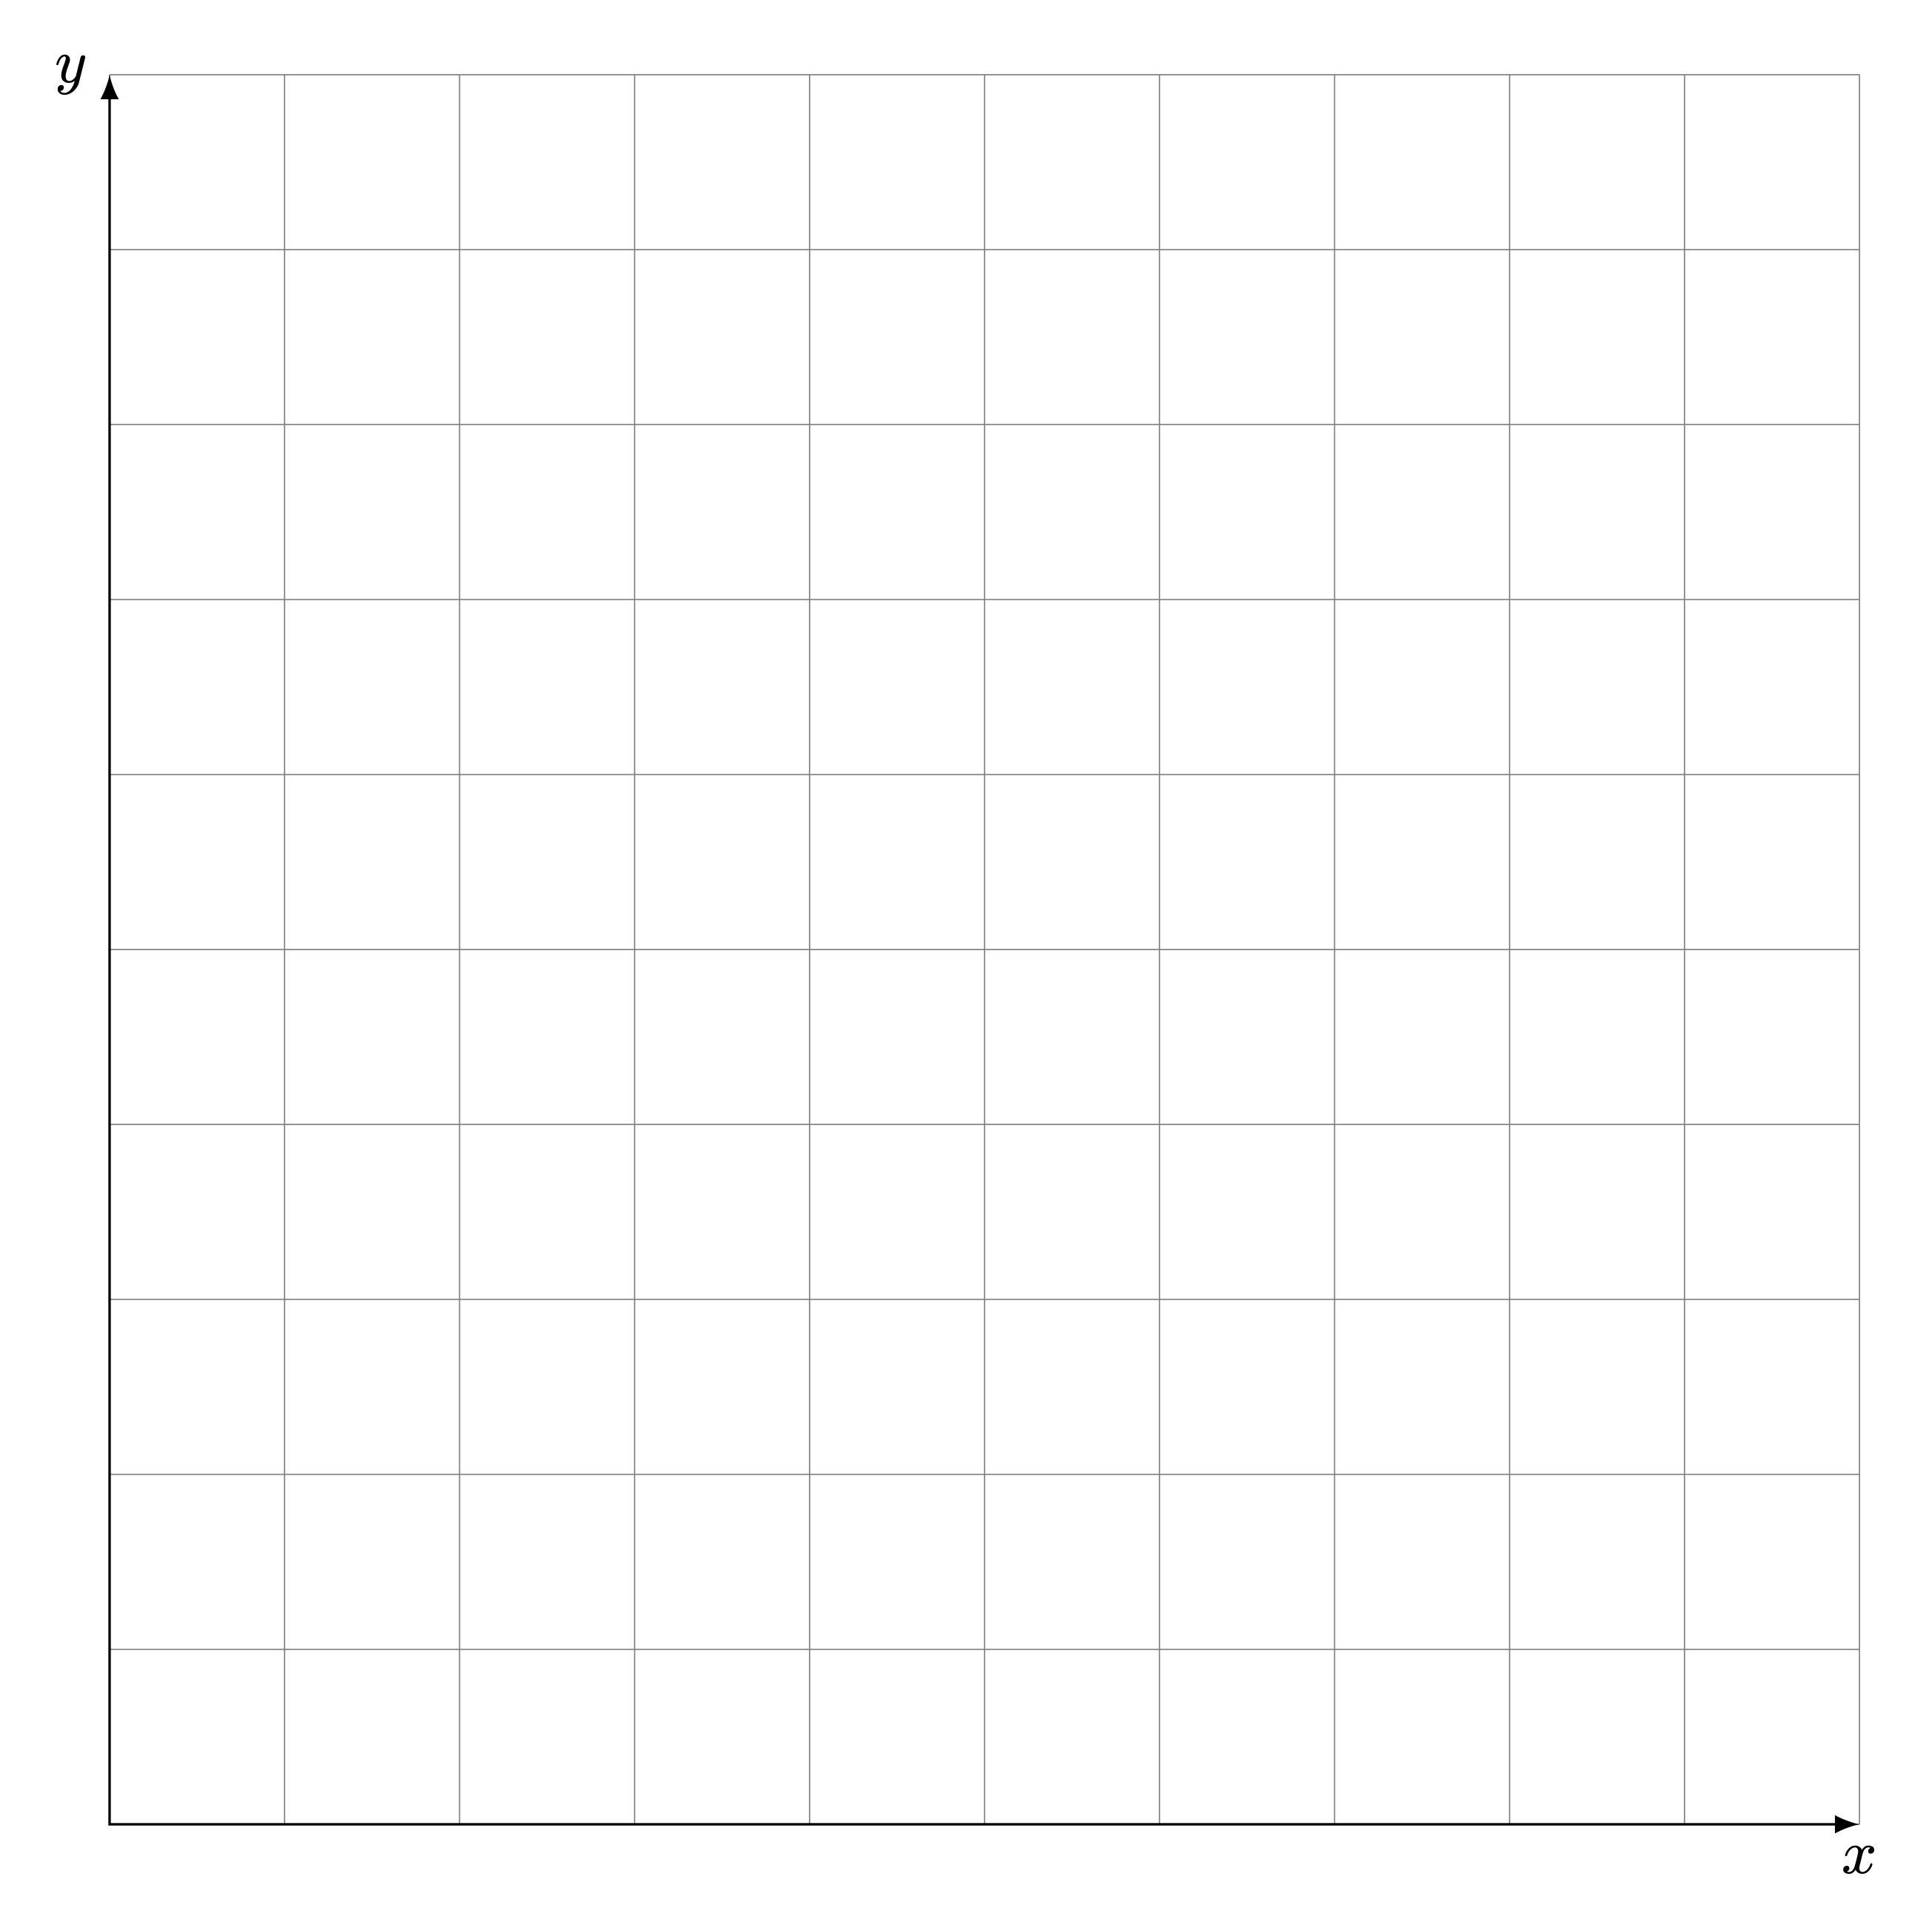
\draw [help lines] (0,0) grid (10,10);
\draw [<->] (10,0) node[below]{$x$} -- (0,0) -- (0,10) node[left]{$y$};

% Changing the thickness of lines
%\draw [ultra thick] (0,1) -- (2,1);
%\draw [thick] (0,0.5) -- (2,0.5);
%\draw [line width=0.2cm] (4,.75) -- (5,.25);

% Dashes and dots
%\draw [dashed, ultra thick] (0,1) -- (2,1);
%\draw [dotted] (0, 0.5) -- (2,0.5);

% Colors
%\draw [blue] (0,1) -- (2,1);
%\draw [red] (0, 0.5) -- (2,0.5);

% Circles, ellipses and polygons and curves
%\draw [blue] (1.5,1.5) rectangle (3.5,5.5);
%\draw [red, ultra thick] (3,0.5) circle [radius=0.5];
%\filldraw[color=red!60, fill=red!5, very thick](8,8) circle (1.5);
%\draw [gray] (5,5) arc [radius=2, start angle=0, end angle= 90];
%\draw[ultra thick, ->] (6.5,2) arc (0:270:1);
%\draw[blue, very thick] (0,0) rectangle (3,2);
%\draw[orange, ultra thick] (4,0) -- (6,0) -- (5.7,2) -- cycle;
%\fill[blue!50] (7.5,4) ellipse (1.5 and 0.5);

% Arrows
%\draw [->] (0,0) -- (2,0);
%\draw [<-] (0, 0.5) -- (2,0.5);
%\draw [|->] (0,1) -- (2,1);

% Coordinate System
%\draw[<->] (10,0) node[below]{$x$} -- (0,0) -- (0,10) node[left]{$y$};

% Plotting functions
%\draw[green, ultra thick, domain=0:1] plot (\x, {0.025+\x+\x*\x}); %function: 0.025 + x + x^2
%\draw [help lines, ->] (0,-1.1) -- (0,1.1);
%\draw [green,domain=0:2*pi] plot (\x, {(sin(\x r)* ln(\x+1))/2});
%\draw [red,domain=0:pi] plot (\x, {sin(\x r)});
%\draw [blue, domain=pi:2*pi] plot (\x, {cos(\x r)*exp(\x/exp(2*pi))});

% Filling up simple areas
%\draw [fill=red,ultra thick] (0,0) rectangle (1,1);
%\draw [fill=red,ultra thick,red] (2,0) rectangle (3,1);
%\draw [blue, fill=blue] (4,0) -- (5,1) -- (4.75,0.15) -- (4,0);
%\draw [fill] (7,0.5) circle [radius=0.1];
%\draw [fill=orange] (9,0) rectangle (11,1);
%\draw [fill=white] (9.25,0.25) rectangle (10,1.5);

% Filling up arbitrary areas
%\draw [ultra thick] (0,0) to [out=87,in=150] (1,1) -- (.85,.15) -- (0,0);
%\draw [ultra thick, fill=purple] (2,0) to [out=87,in=150] (3,1) -- (2.85,.15) -- (2,0);
%\path [fill=purple] (4,0) to [out=87,in=150] (5,1) -- (4.85,.15) -- (4,0);

% Putting labels in pictures
%\node at (5,5) {node};
%\draw[fill] (1,1) circle [radius=0.025];
%\node [below right, red] at (1,1) {below right};
%\node [above left, green] at (1,1) {above left};
%\node [below left, purple] at (1,1) {below left};
%\node [above right, magenta] at (1,1) {above right};

% Tangency
%\draw [help lines] (0,0) grid (5,5);
%\draw [<->] (5,0) -- (0,0) -- (0,5);
%\draw (4,0) -- (0,4);
%\draw[dashed,ultra thick](1.5,3.5) to [out=-80,in=135] (2.5,1.5);
%\draw [dashed,ultra thick](2.5,1.5) to [out=-45,in=160] (4.2,0.5);

% Tangent Coordinate Systems
%\draw[help lines] (0,0) grid (3,2);
%\coordinate (a) at (3,2);
%\node [circle,draw] (c) at (1,1) [minimum size=40pt] {$c$};
%\draw[red] (a) -- (tangent cs:node=c,point={(a)},solution=1) -- (c.center) -- (tangent cs:node=c,point={(a)},solution=2) -- cycle;

% Intersections of Perpendicular Lines
%\path (30:1cm) node(p1) {$p_1$} (75:1cm) node(p2) {$p_2$};
%\draw (-0.2,0) -- (1.2,0) node(xline)[right] {$q_1$};
%\draw (2,-0.2) -- (2,1.2) node(yline)[above] {$q_2$};
%\draw[->] (p1) -- (p1 |xline);
%\draw[->] (p2) -- (p2 |xline);
%\draw[->] (p1) -- (p1 -| yline);
%\draw[->] (p2) -- (p2 -| yline);

% Relative and Incremental Coordinates
%\draw [help lines] (0,0) grid (4,4);
%\draw (0,0) -- ++(1,0) -- ++(0,1) -- ++(-1,0) -- cycle;
%\draw (2,0) -- ++(1,0) -- ++(0,1) -- ++(-1,0) -- cycle;
%\draw (1.5,1.5) -- ++(1,0) -- ++(0,1) -- ++(-1,0) -- cycle;
%\draw (0.5,0.5) -- (1,1.25) -- ([turn]-45:1cm) -- ([turn]-30:1cm);
%\draw plot coordinates {(0,0) (1,1) (2,0) (3,0) } -- ([turn]30:1cm);

% More Coordinates
%\draw [help lines] (0,0) grid (3,3);
%\coordinate (a) at (1,0);
%\coordinate (b) at (3,2);
%\draw[->,thick,blue] (a) -- (b);
%\coordinate (c) at ($ (a)!1! 10:(b) $);
%\draw[->,red] (a) -- (c);
%\fill ($ (a)!.5! 10:(b) $) circle (2pt);

% The Arc Operation
%\begin{tikzpicture}[radius=1cm,delta angle=30]
%\draw (-1,0) -- +(3.5,0);
%\draw (1,0) ++(210:2cm) -- +(30:4cm);
%\draw (1,0) +(0:1cm) arc [start angle=0];
%\draw (1,0) +(180:1cm) arc [start angle=180];
%\path (1,0) ++(15:.75cm) node{$\alpha$};
%\path (1,0) ++(15:-.75cm) node{$\beta$};
%\end{tikzpicture}

% Graphic Parameters: Fill Pattern
%\draw[pattern=dots] (0,0) circle (1cm);

% Two vectors sum
%\begin{tikzpicture}[line cap=round]
% \coordinate (O) at (0,0);
% \coordinate (A) at ( 0:2.1);
% \coordinate (B) at ( 55:1.4);
% \coordinate (A+B) at ($(A)+(B)$);
%
% \draw[vector,thin arrow,myred!40] (B) -- (A+B) node[midway,above] {$\vb{a}$};
% \draw[vector,thin arrow,myblue!40] (A) -- (A+B) node[midway,below right=-2] {$\vb{b}$};
%
% \draw[vector,myred] (O) -- (A) node[midway,below] {$\vb{a}$};
% \draw[vector,myblue] (O) -- (B) node[midway,above left=-2] {$\vb{b}$};
% \draw[vector,mypurple] (O) -- (A+B) node[above right=-3] {$\vb{a}+\vb{b}$};
%\end{tikzpicture}

\end{tikzpicture}
\end{document}
Output


